
Your visitors
The dashboard at a glance
What this does
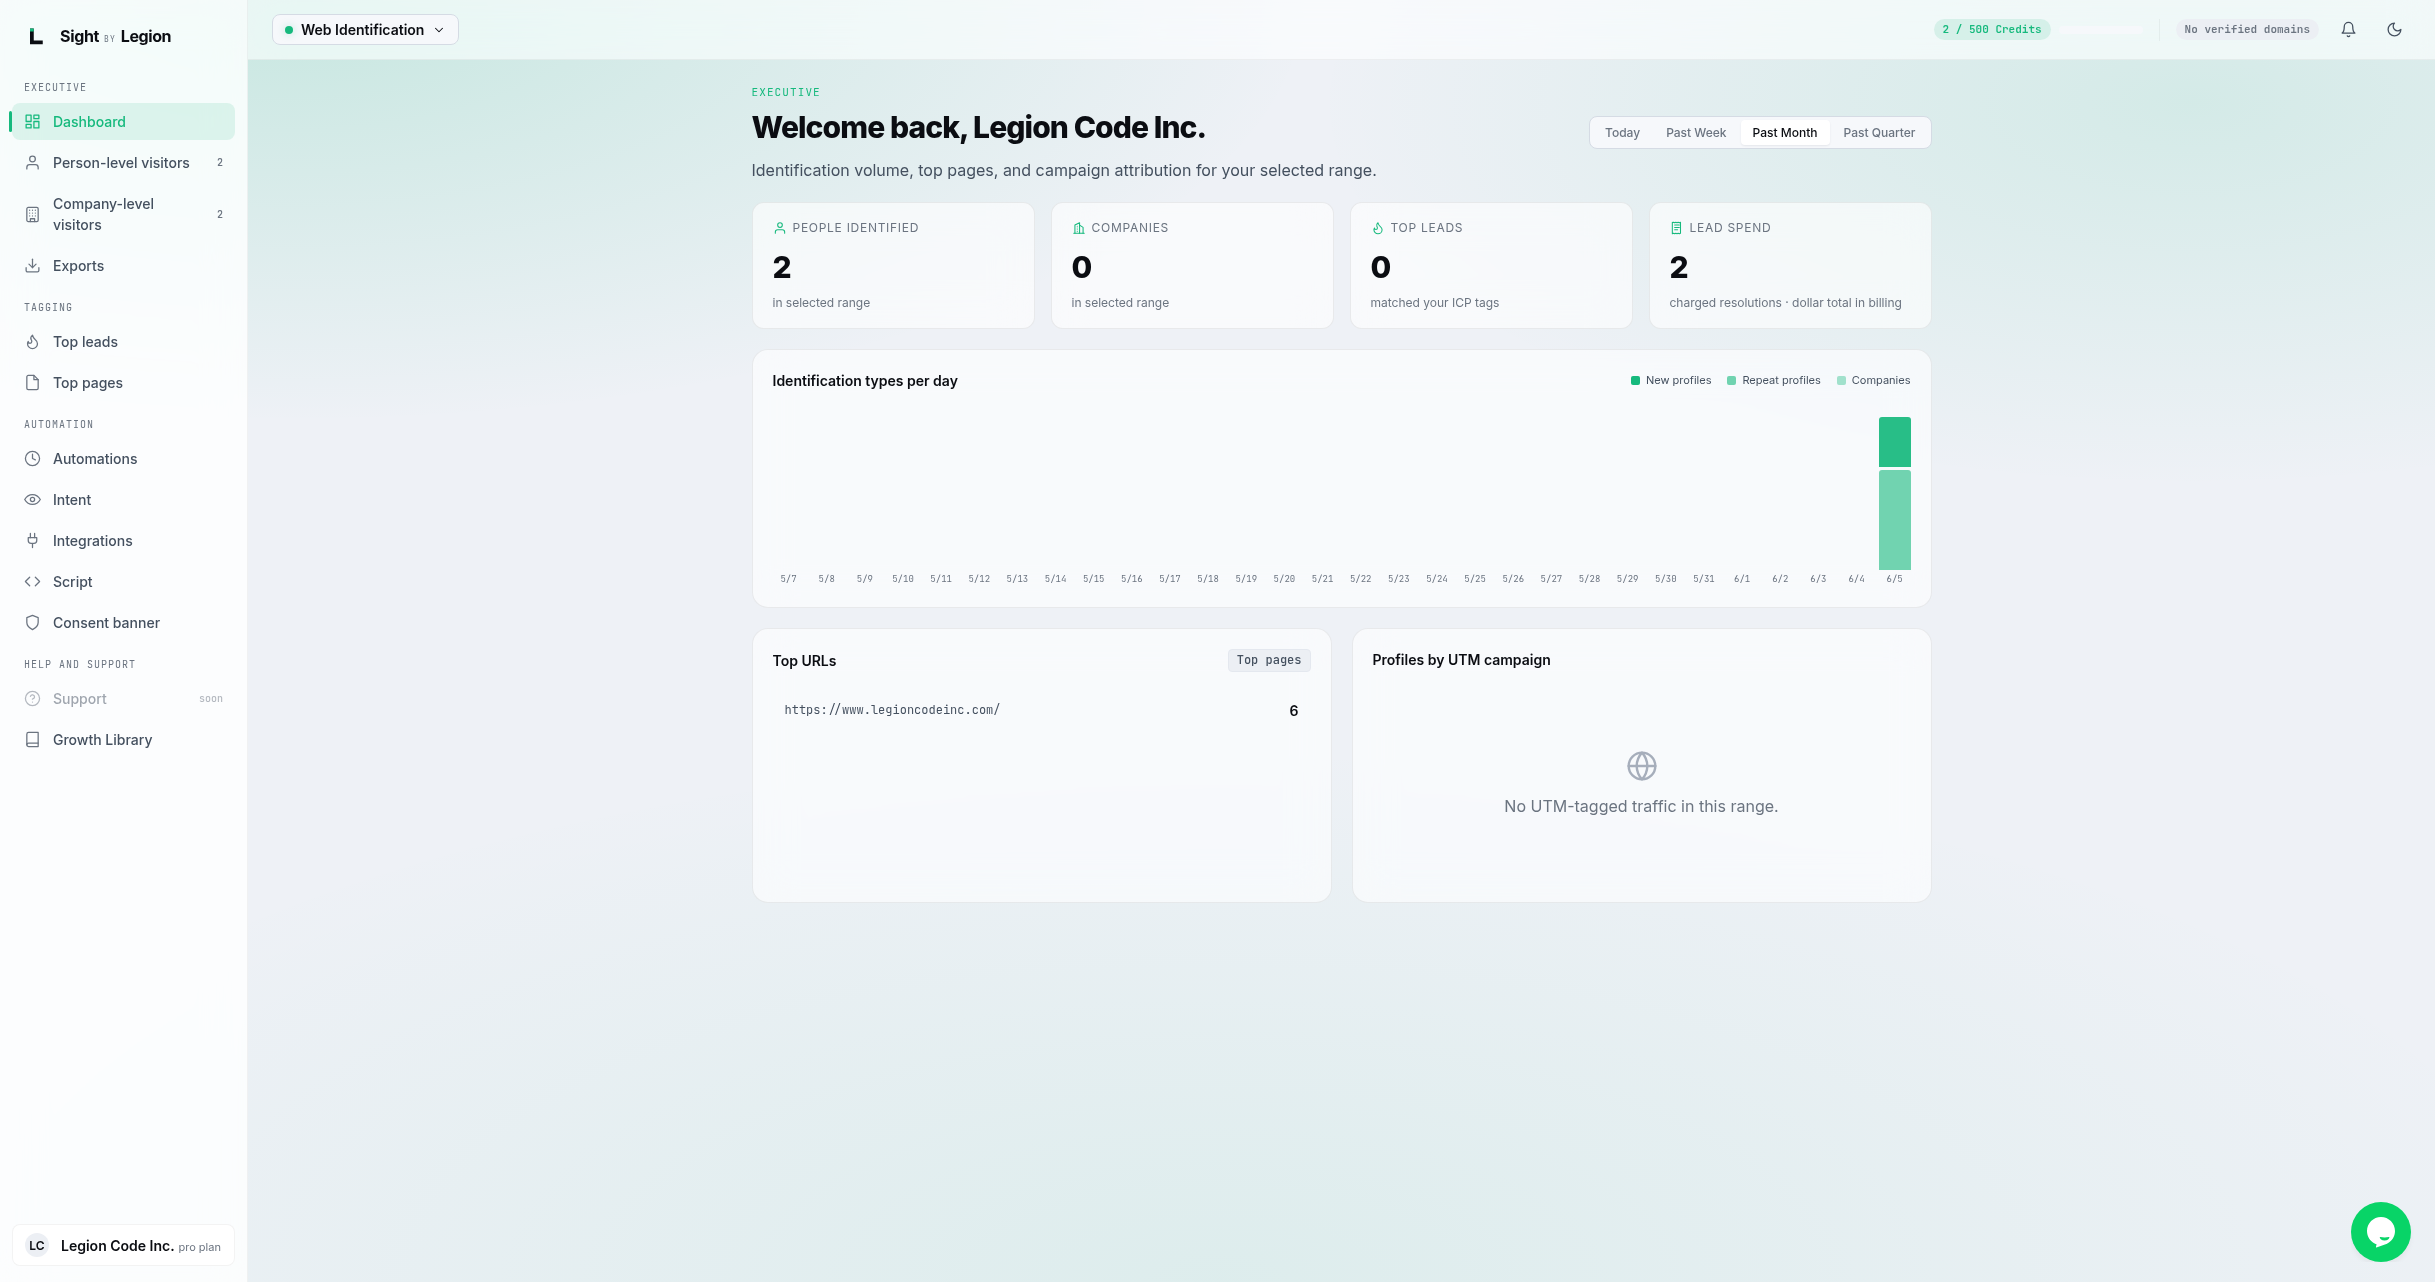
The Dashboard is your home screen. It summarizes how many people and companies OSPRY identified, your top pages, and which campaigns drove identified visitors, for the date range you pick.
Steps
- Open Observe -> Dashboard. It greets you with "Welcome back, [your company]".
- Pick a date range using the selector in the top right: Today, Past Week, Past Month, or Past Quarter. The range is saved in the page address, so you can bookmark or share a view.
- Read the four stat tiles:
- People identified: distinct people identified in the range.
- Companies: distinct companies identified in the range.
- Top leads: identified visitors that matched your ICP tags.
- Lead spend: charged resolutions in the range (the dollar total is on the billing page).
- Review the charts below the tiles:
- Identification types per day: new profiles, repeat profiles, and companies, day by day.
- Top URLs: your five most-visited captured pages in the range.
- Campaign attribution (UTM): identified profiles grouped by campaign.
Tips & FAQs
- Numbers look low or empty? If you just installed the script, give it time to collect and resolve traffic. Confirm the script is verified on the Script page.
- Repeat profiles only show when enabled. The repeat line appears once repeat-visitor collection has recorded return visits. See the Script page capture settings.
- The range is shareable. Because the range lives in the page address, sending a teammate the link shows them the same window.
- Want the underlying records? Drill into Person-level visitors and Company-level visitors.